
How Knowledge Graphs Helped Me Start Minding My Own Business
Knowledge Graph, Florentine Codex by Evelyn Galindo
I thought I understood what was happening in my business… and then I realized I actually didn’t.
When you run a small online business, you see the orders coming in, right? You check your dashboard, you get a sense of what’s selling, and you think you know your customers.
I thought I did.
But the other day I started digging a little deeper into my sales and noticed something weird.
One of my hoodies had been selling really well. Nothing unusual there. But when I started looking closer at the orders, I saw a pattern I hadn’t anticipated.
A lot of the buyers were in California
The design was unisex
And a lot of the buyers were men
But I didn’t design that hoodie for men. I didn’t design it specifically for California either.
And yet somehow, that combination was working.
That’s when it hit me.
My business was probably full of patterns like that… I just couldn’t see them.
Why It’s Hard to See Patterns in a Small Business
The truth is most small businesses are sitting on tons of information.
The problem isn’t the data. The problem is how it’s stored.
Everything is scattered and separated into rows in Excel sheets.
You’ve got:
orders in one place
product designs somewhere else
marketing posts somewhere else
spreadsheets
random notes
It’s just a mess.
And when everything is stored that way, patterns are really hard to see.
The Simple Idea That Changed How I Look at My Data
So I started experimenting with knowledge graphs.
It sounds technical, but the idea is actually really simple.
Instead of storing everything as rows in a spreadsheet, you connect the pieces of information.
For example:
Customer → lives in → California
Customer → bought → this hoodie
Product → design style → unisex
Customer → gender → male
Once you connect the data like that, it basically turns your business information into a map.
And when you start looking at the map, patterns jump out.
What Happens When You Start Connecting Your Data
Once the relationships are visible, you start noticing things like:
People who bought one product often buy another product
Certain design styles appeal to certain types of customers
Some regions gravitate toward particular aesthetics
It’s kind of wild because the information was always there.
I just never had it organized in a way where I could actually see the connections.
Where AI Makes This Even More Powerful
Now imagine combining that structured data with AI.
When your business data is connected like this, you can start asking questions like:
What products should I create next?
What designs are selling best with men?
What do customers in California tend to buy?
Instead of guessing, the system can analyze all those relationships and surface insights.
Big companies do this all the time. They have entire teams analyzing customer behavior.
But the tools are getting good enough now that even one-person businesses can start doing it.
And that’s incredibly exciting.
Because once you start seeing the patterns in your own business, it changes how you:
design products
market them
grow your business
Most Small Businesses Already Have the Data
Here’s the crazy part.
Most small businesses are already sitting on this kind of insight.
They just can’t see it yet.
A Data Mapping Experiment from the 1500s
As a little experiment, I decided to push the idea even further and try mapping something that seemed almost impossible to structure.
So I picked a handwritten text from the 1500s in Mexico.
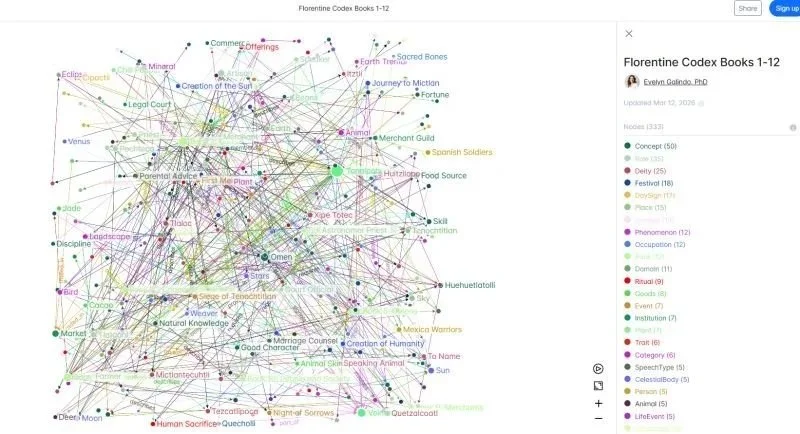
It’s called the Florentine Codex, a 12-book work created by Bernardino de Sahagún and a team of Nahua scholars.
The work documents an entire civilization — their:
gods
plants
animals
rituals
social roles
daily life
What’s fascinating is that the work already functions like a kind of schema of knowledge.
But when you convert it into a knowledge graph, you start seeing connections across domains in a completely new way.
It’s a reminder that structuring knowledge isn’t actually a new problem.
People have been acting as data architects for centuries.
Explore the Graph
I shared the graph below if you want to explore it.
(Press the spacebar to run the layout and reorganize the network.)
Florentine Codex Books 1-12 | Graph Commons
Curious what patterns yousee in it.